Chart Report
Elevate Your Investment Strategy with Unmatched Insights
Welcome to the Chart Report, the cornerstone of FT Cloud's offerings, designed to furnish investors with a panoramic view of essential data and statistics for informed decision-making.
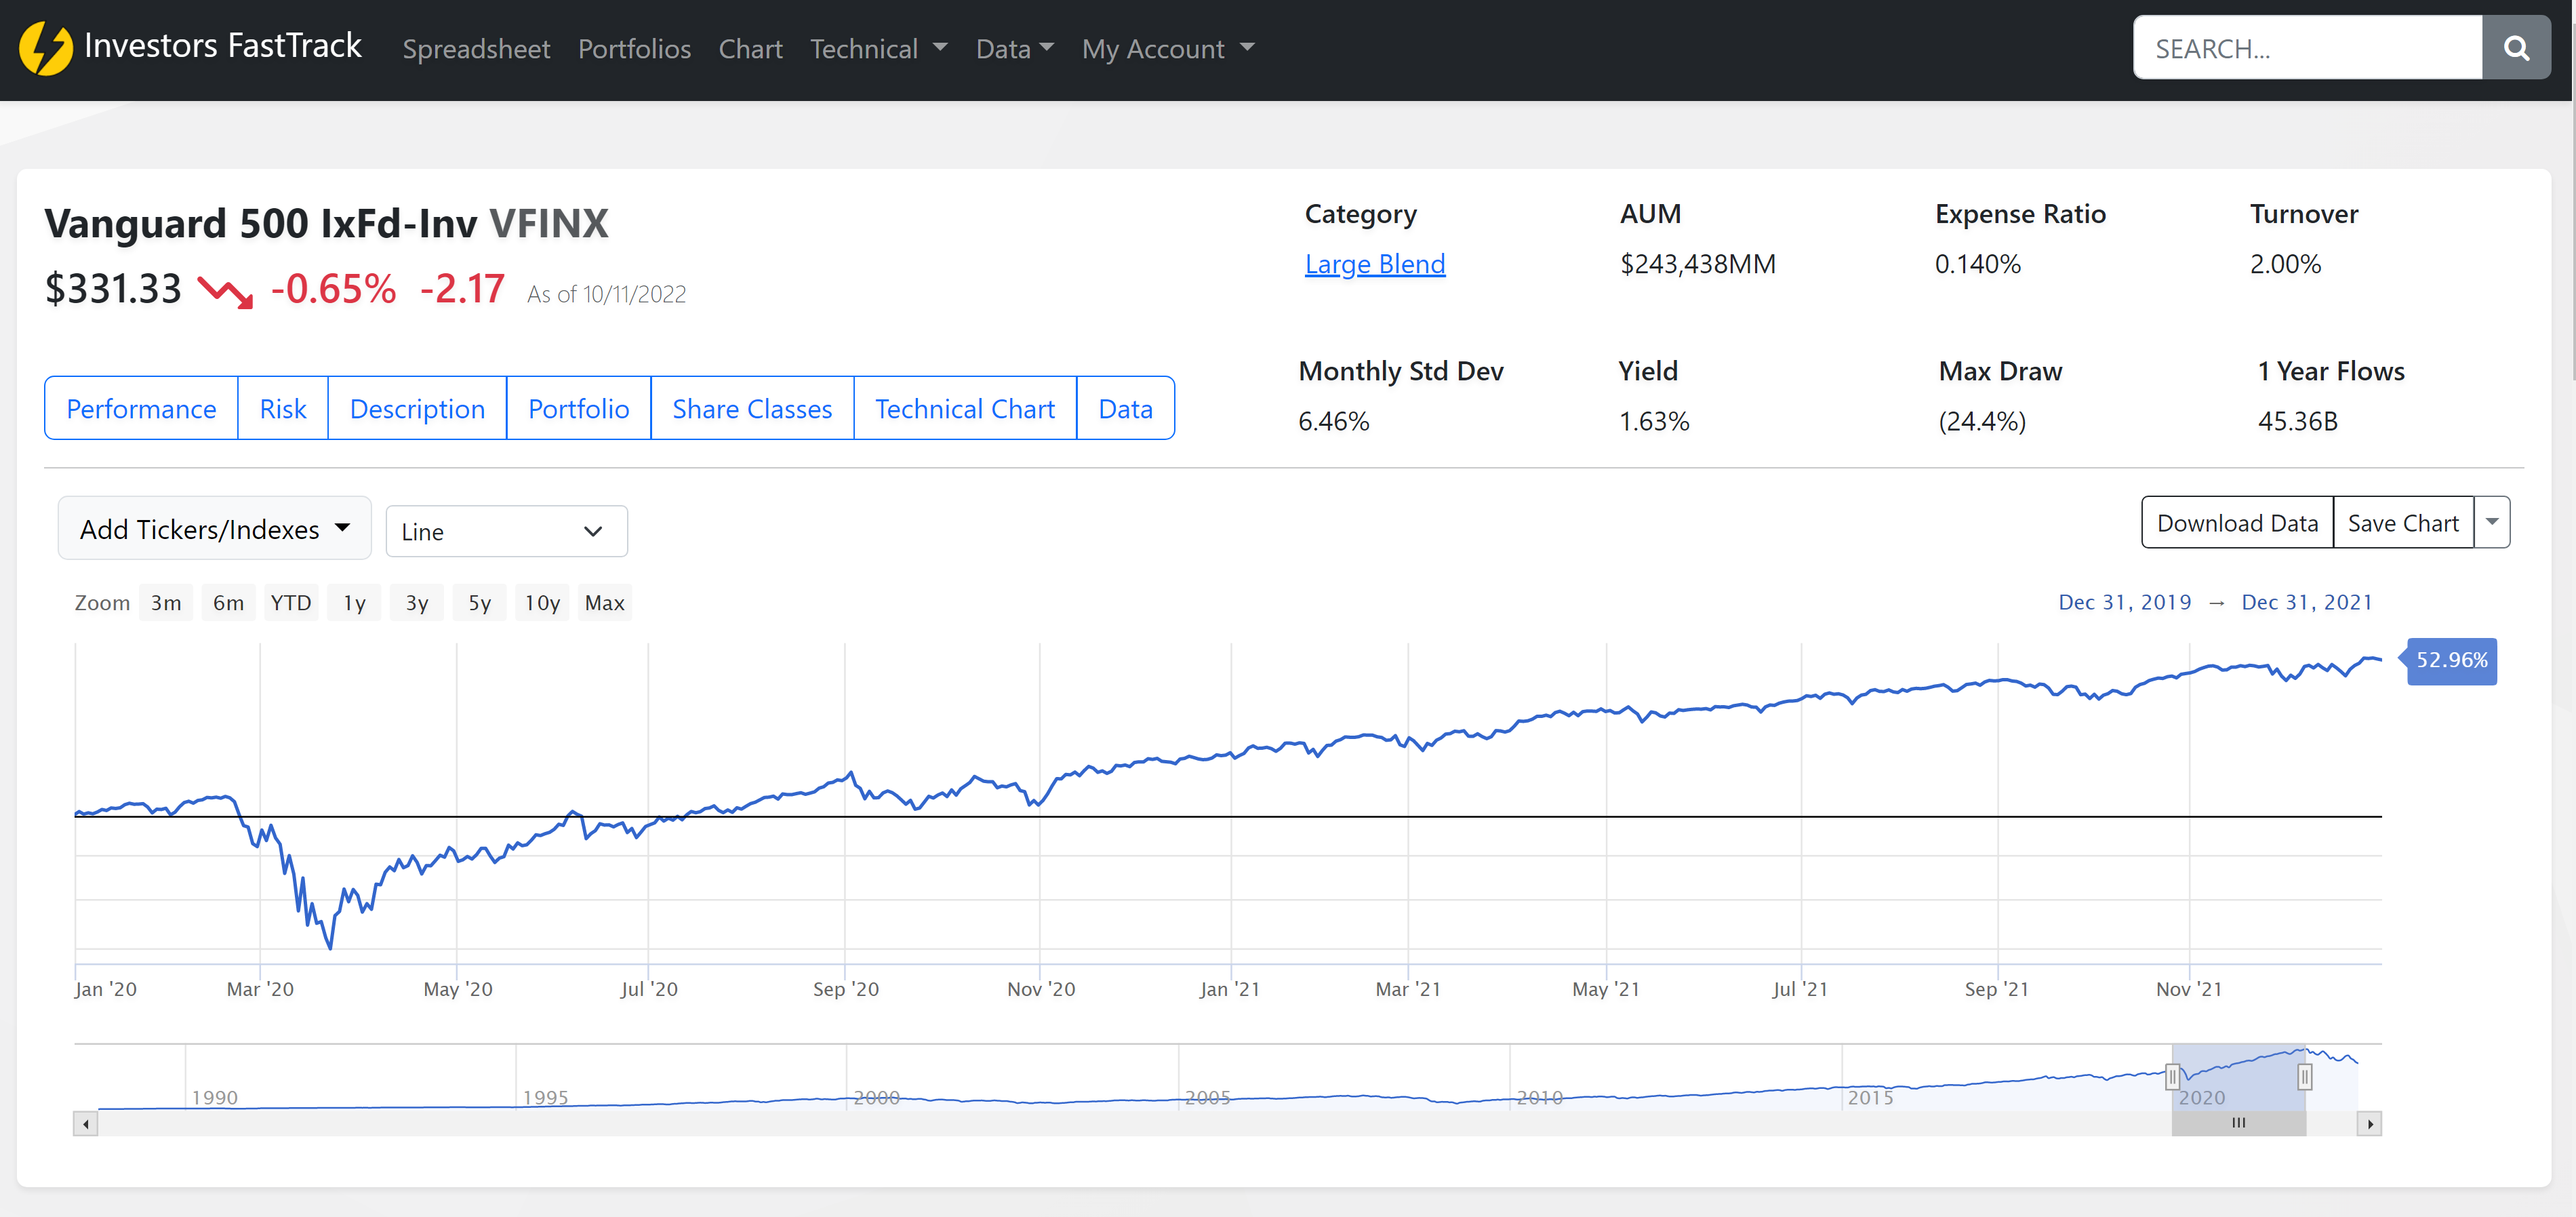
Navigate the Investment Landscape with Precision
Dive into the Chart Report, where data meets design, offering a segmented overview of vital investment information across various sections.
Header: Gateway to Key Insights
The header unfurls the essence of the security — its name, the latest closing price, and the day's change, encapsulated at the top left, ensuring immediate access to crucial data. The closing price's date anchors the information in the context of time, enhancing its relevance.
To the right, a digest of summary information varies with the security type, tailored to provide a snapshot of its fundamental attributes.
Blue navigation buttons below the header offer swift passage to different report segments, streamlining your exploration.
Chart: A Visual Odyssey
Embark on a visual journey with the semi-log chart that traces the security's trajectory over your chosen period.
Dates: Customize the timeline using the start and end date selectors or dynamically adjust the view via the chart's interactive lower portion.
Comparisons:
Enrich your analysis by adding comparative tickers or indexes, enabling a multifaceted view of performance dynamics. For multiple tickers, separate each ticker with a comma (",").
Chart Values:
Interactive tooltips reveal detailed metrics, including total returns and security values, as you navigate through the chart's timeline.
Download & Save:
- Download Data for in-depth analysis or
- Save Chart options, including format, size, and customization features, perfect for presentations or sharing.
Click the down arrow on the Save Chart button to display the save chart options.
Performance, Risk, and Detailed Insights: Decode the Numbers
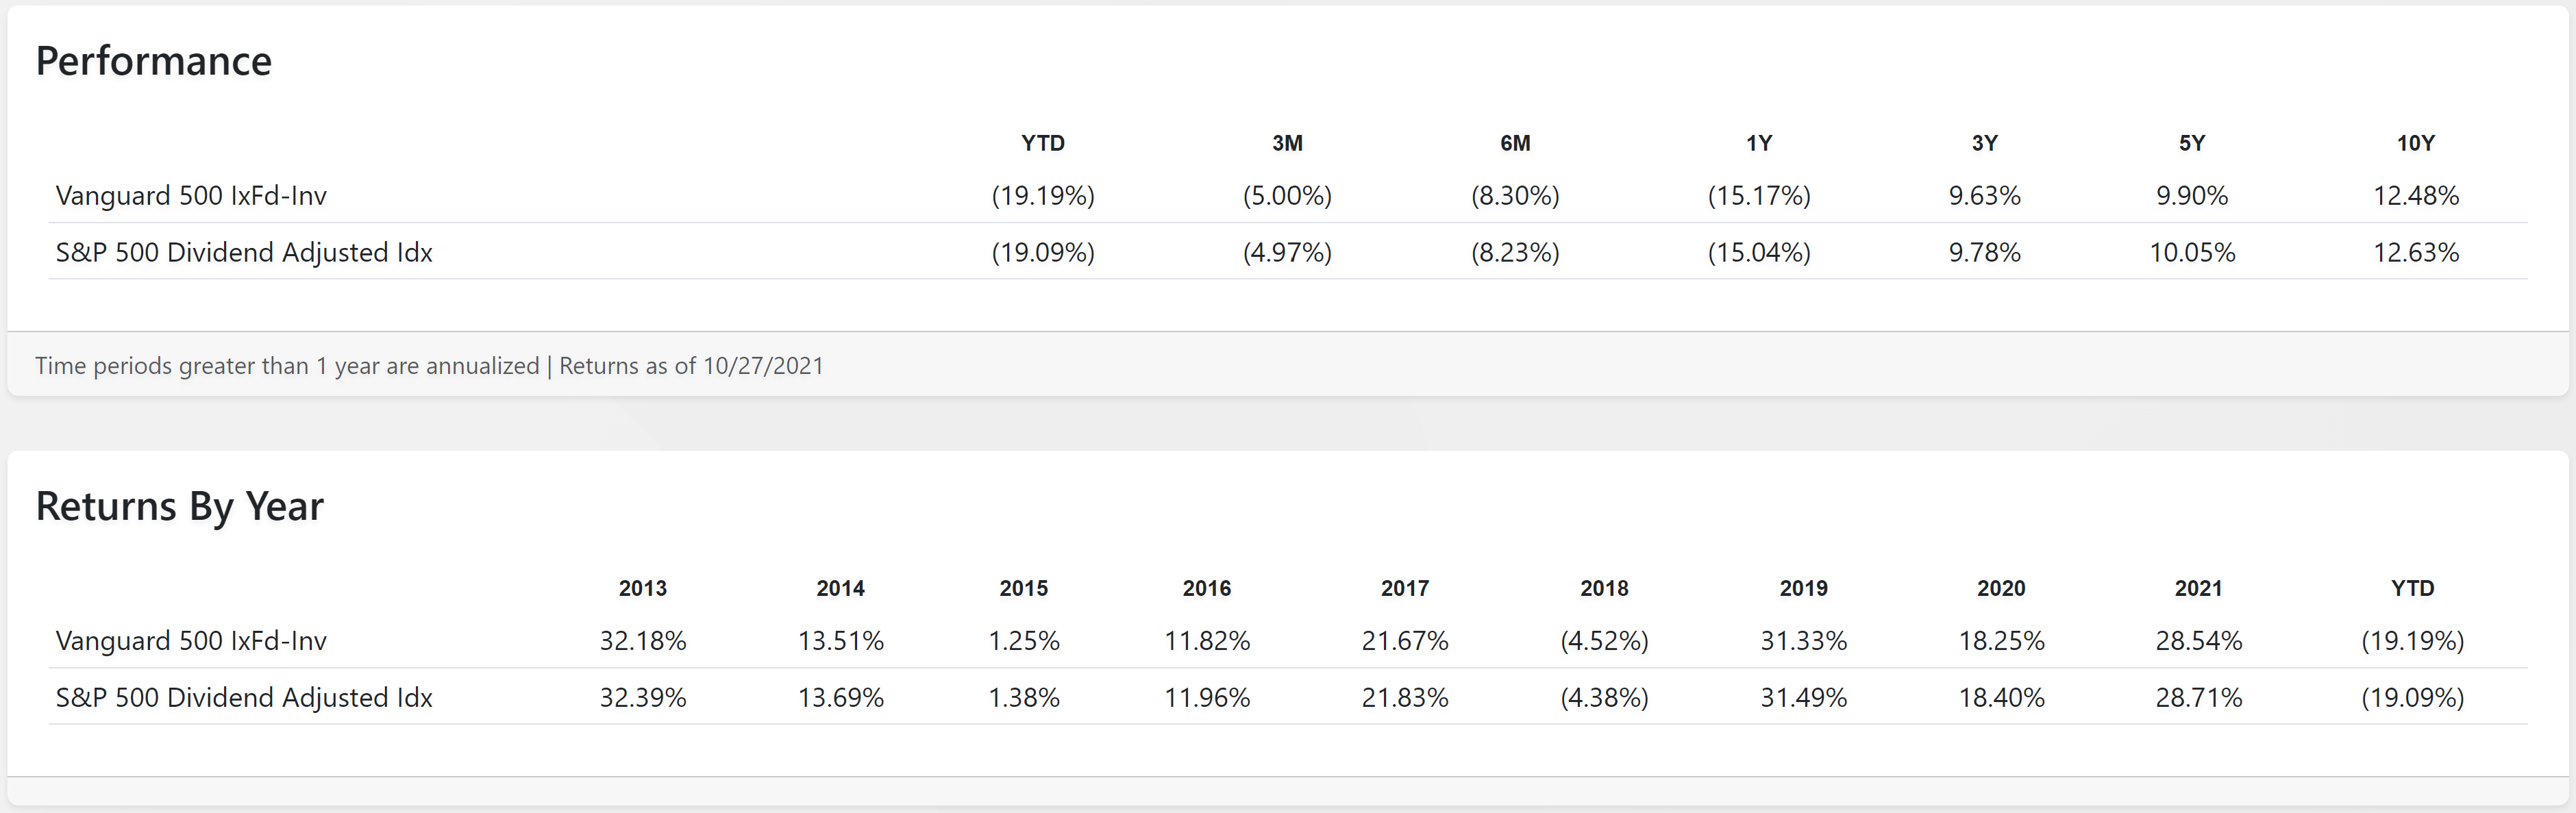
- Performance and Return by Year: Traverse through annualized returns and total return metrics, with a clear depiction of the current year's performance.
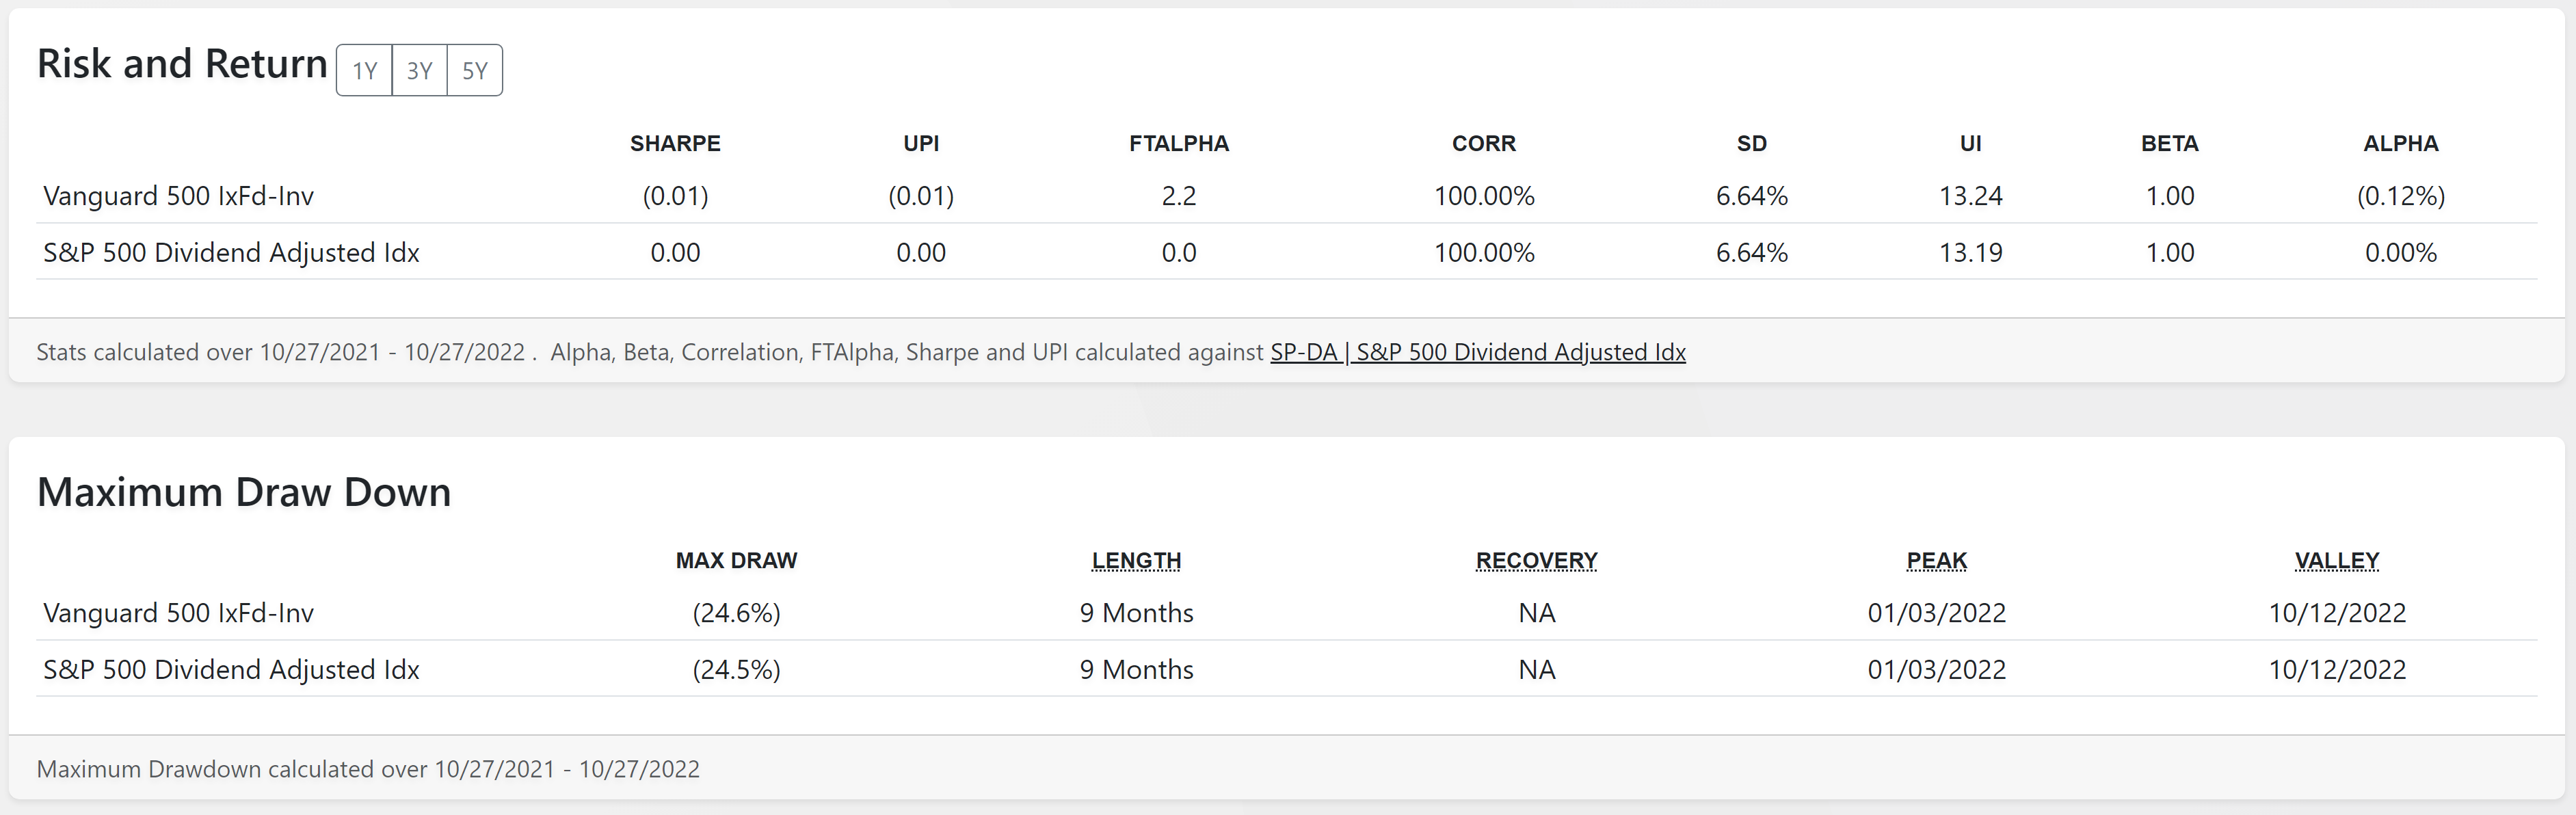
- Risk, Return, and Maximum Drawdown: Equip yourself with comprehensive risk and return assessments, including pivotal metrics like Alpha, Beta, and Sharpe ratios, against the FastTrack Index benchmark.

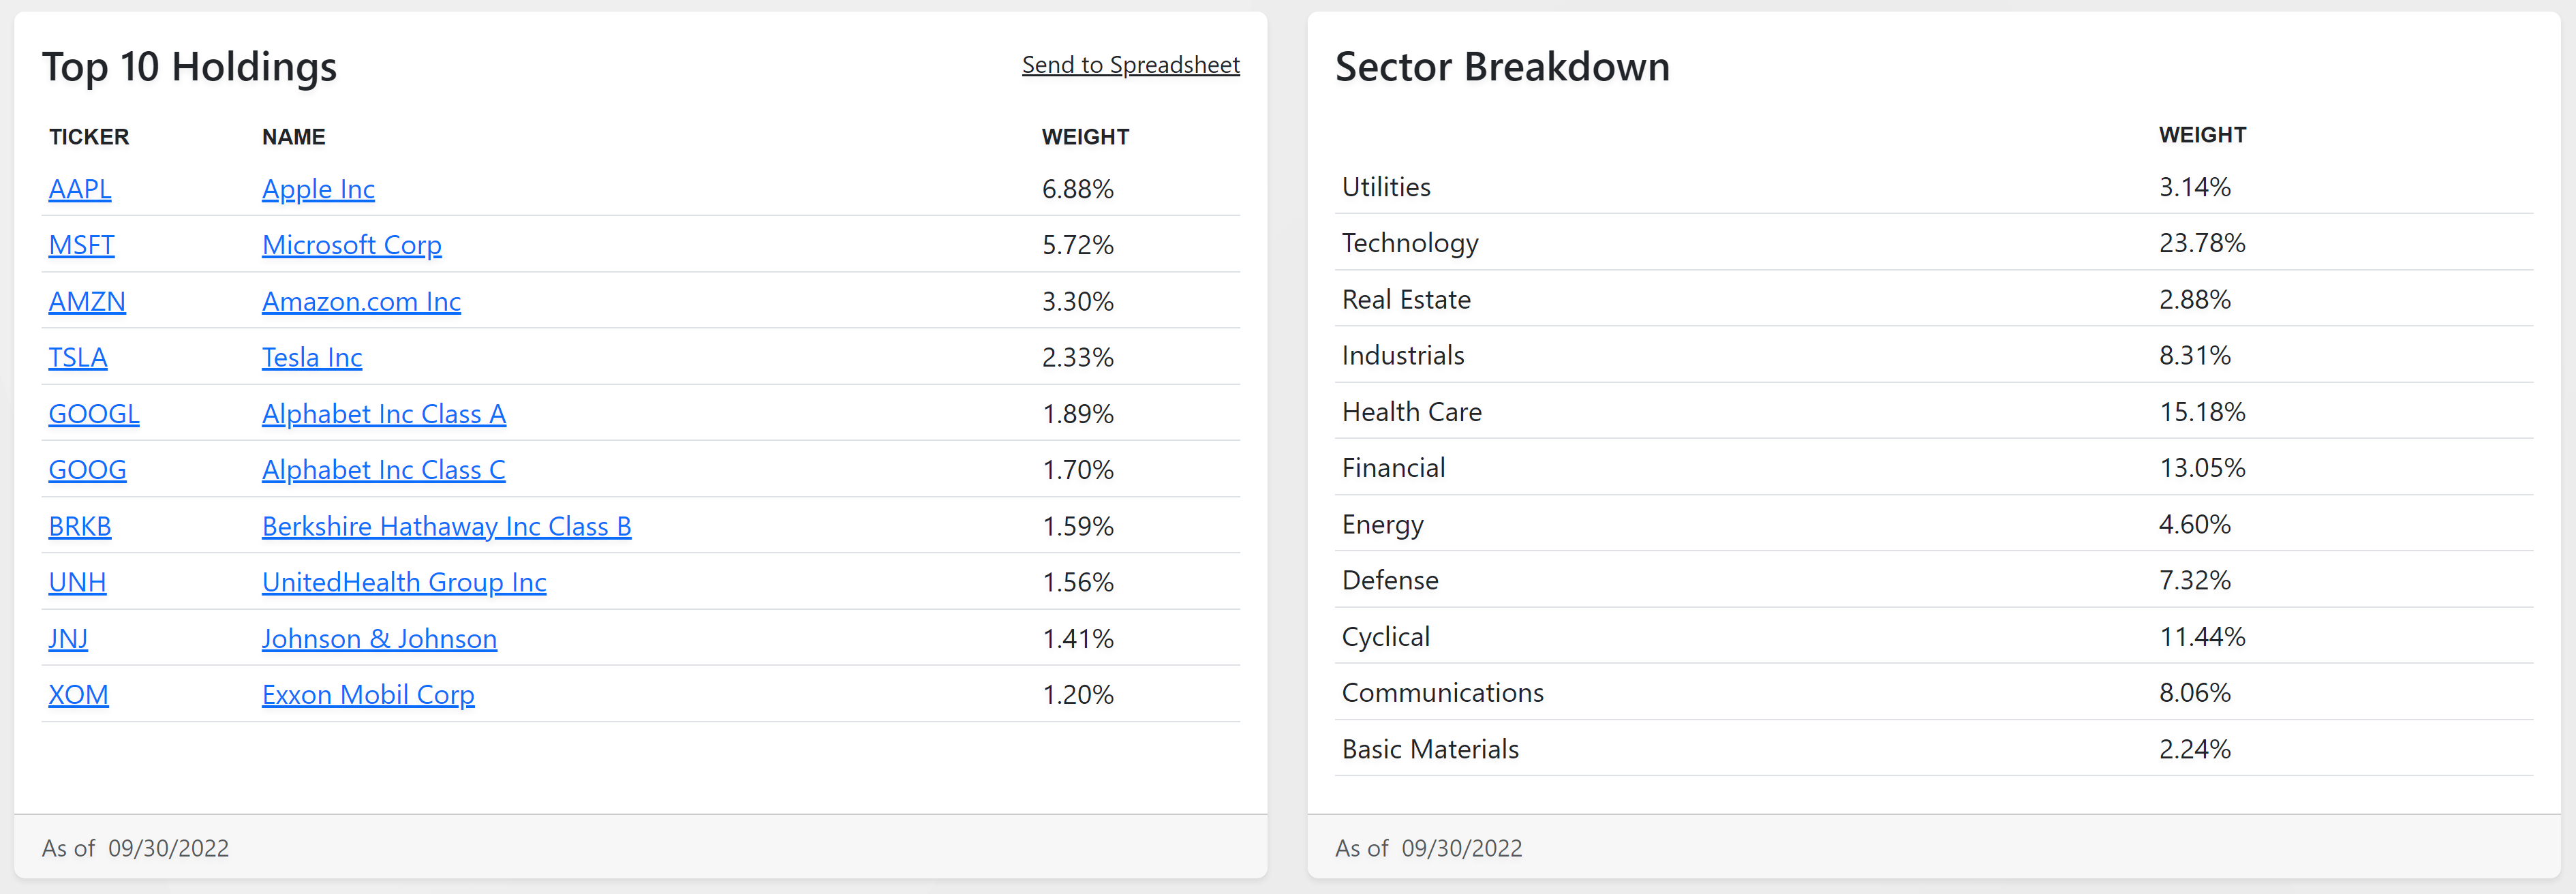
- Detailed Info & Top Holdings Delve deeper into the securities with extensive data points and top holdings information, elevating your research with actionable insights.
Purchase Details & Family Membership: Beyond Basics
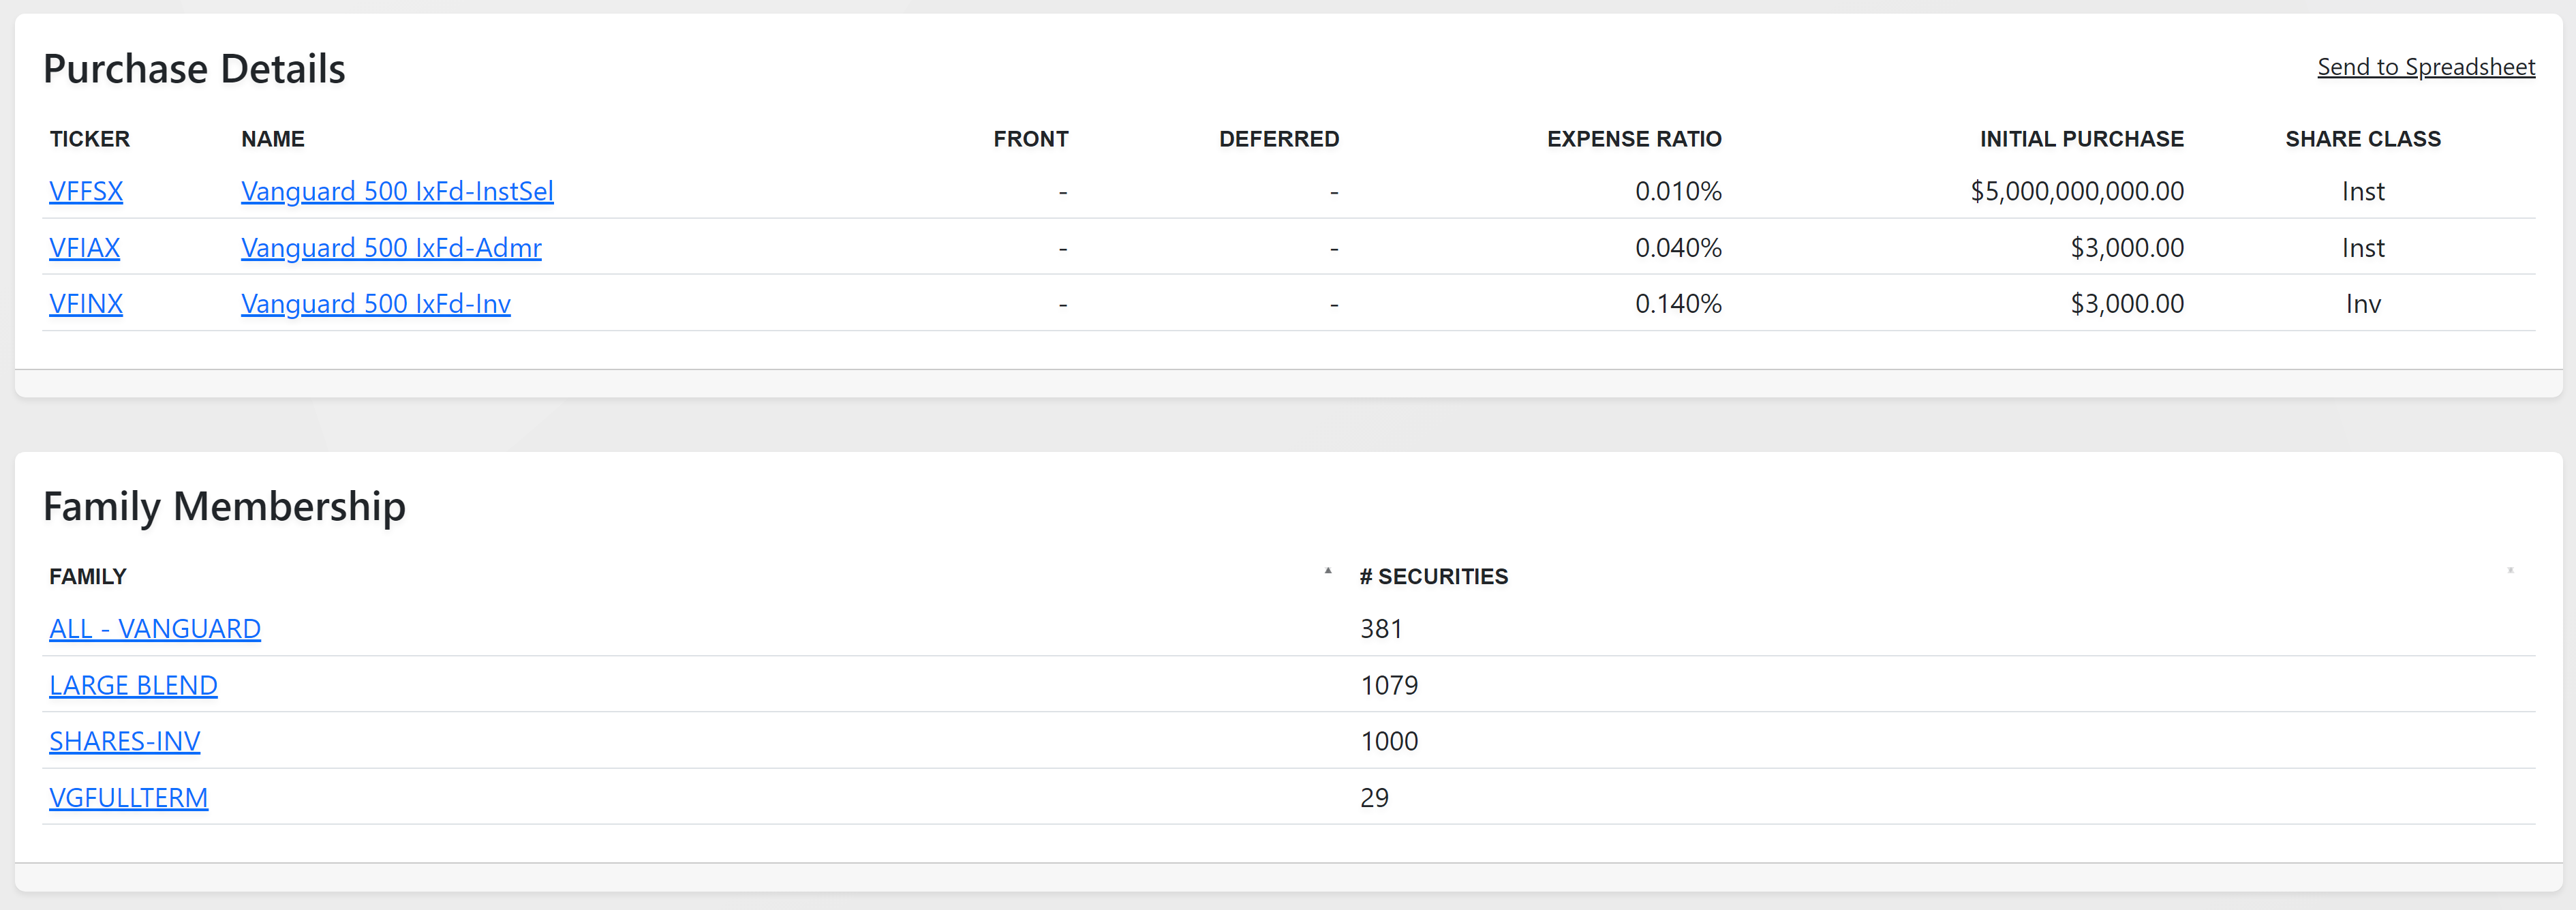
Purchase Details: Navigate through mutual fund share classes, fees, and minimums, offering a transparent view into your investment choices.
Family Membership: Discover related securities through family memberships, a quick path to expanding your investment horizon.
Transform your investment strategy with the Chart Report from FT Cloud. With each section designed to provide a deeper understanding and actionable insights, you're equipped not just to analyze but to excel in the financial markets. Explore, analyze, strategize, and unlock the full potential of your investments with unparalleled clarity and precision.